
Monitoring Program Data View Archives
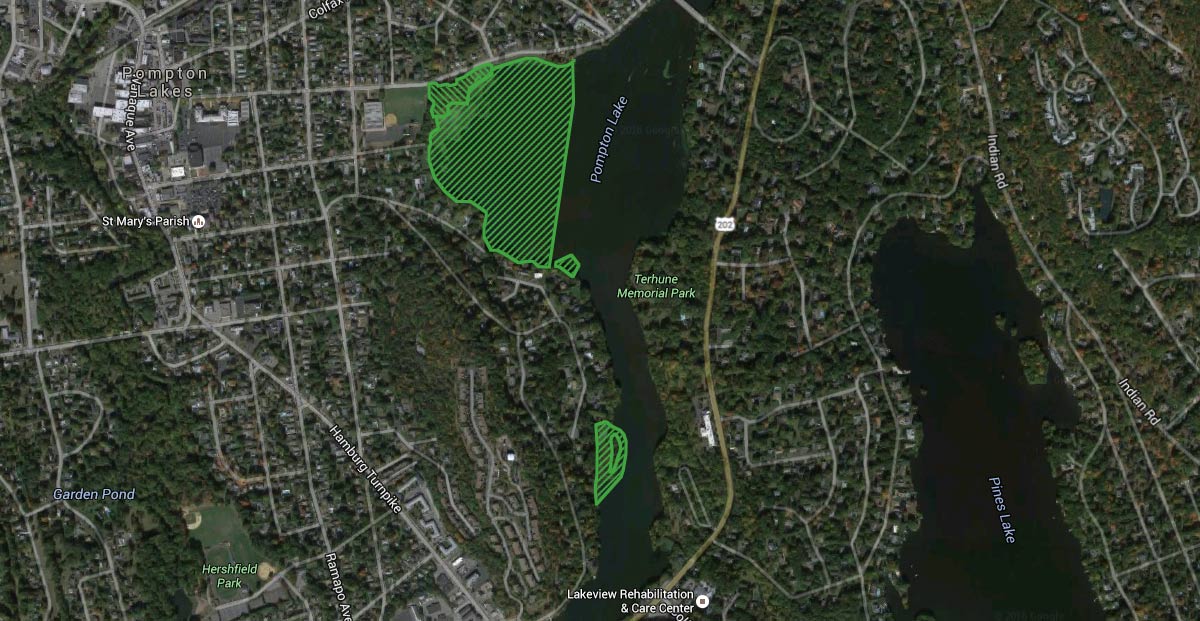
Environmental monitoring of surface water (turbidity), air (dust and mercury vapor), and noise was conducted in accordance with the CMI work plan during the removal phases of the remediation program. Chemours is committed to sharing monitoring data (turbidity, dust, mercury vapor) collected during remedy implementation with the community. The graphs below contain data from the various monitoring locations around the project area.1. Wind Monitoring
Click Image to Enlarge
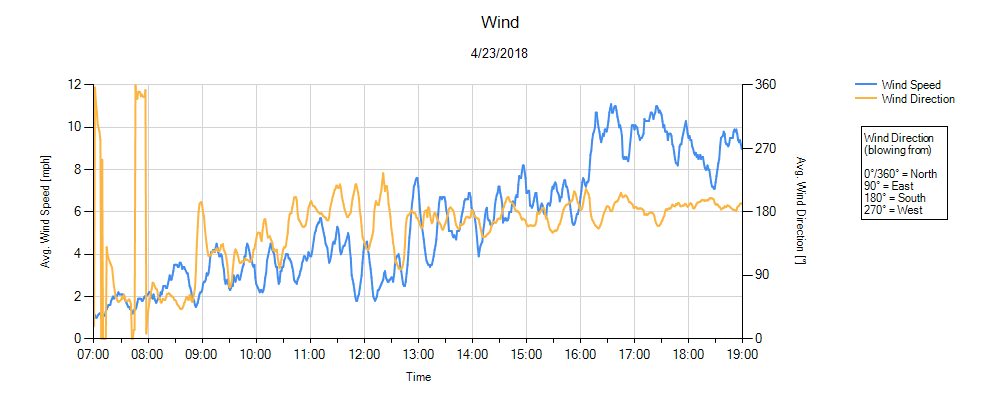
2. PM10 Particulate (Dust) Monitoring
Click Image to Enlarge
Comments
There was an elevated dust reading at monitoring station AM-2 at 1741. There was no site work being conducted at that time (i.e., unloading trucks of eco-layer material or moving eco-layer material around with equipment). However, there was some re-fueling and equipment maintenance being performed in the area.
The action level = initial threshold concentration (150 ug/m3) + upwind concentration (24.2 ug/m3 [AM-3 at 1741]) = 174.2 ug/m3. The elevated reading at AM-2 was 164.5 ug/m3.
3. Mercury Vapor Monitoring

Click Image to Enlarge
Comments
Dredging and sediment processing complete – mercury vapor monitoring no longer being conducted.
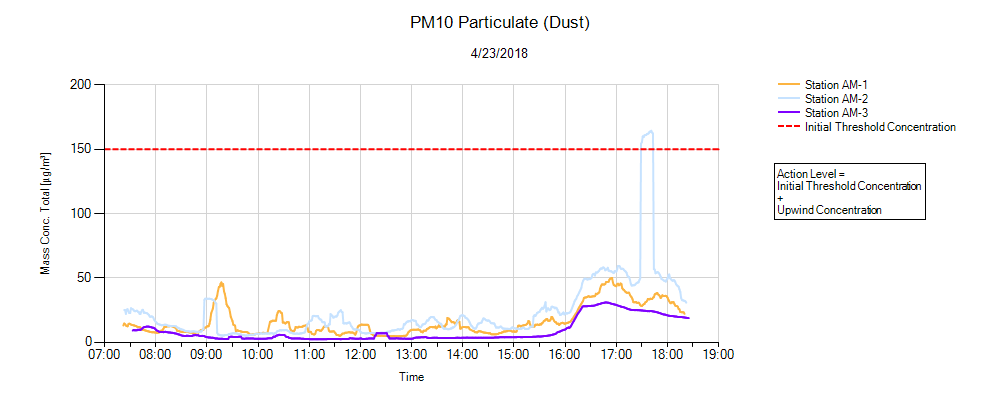
4. Turbidity Monitoring
Click Image to Enlarge
View Archives