
Monitoring Program Data View Archives
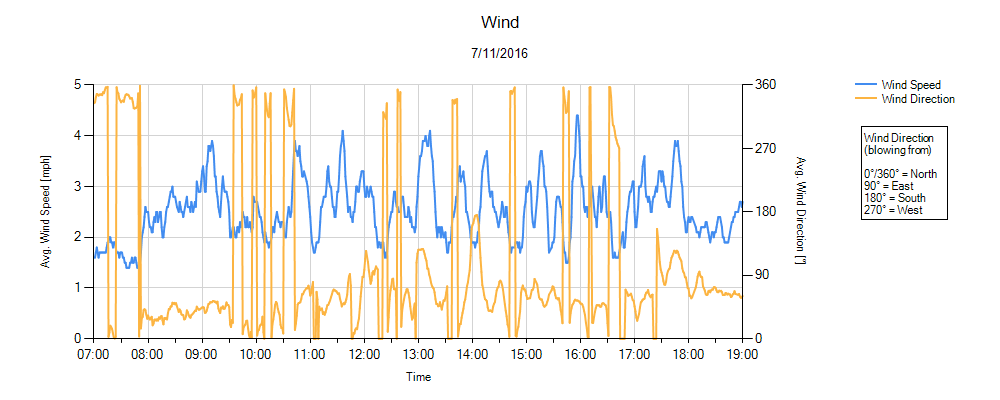
Environmental monitoring of surface water (turbidity), air (dust and mercury vapor), and noise was conducted in accordance with the CMI work plan during the removal phases of the remediation program. Chemours is committed to sharing monitoring data (turbidity, dust, mercury vapor) collected during remedy implementation with the community. The graphs below contain data from the various monitoring locations around the project area.1. Wind Monitoring
Click Image to Enlarge
2. PM10 Particulate (Dust) Monitoring
Click Image to Enlarge
Comments
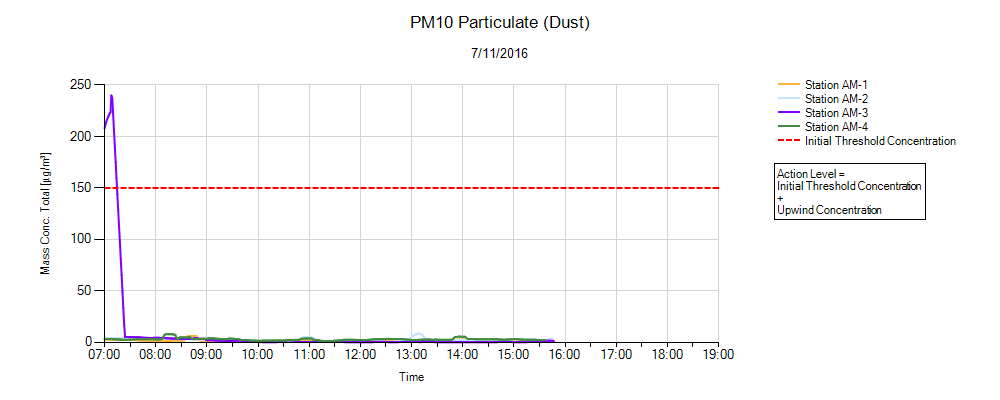
Based on a review of the dust data and site activities at the time (work had not started yet for the day), it appears there was a dust meter malfunction at the upwind monitoring station (AM-3) causing the elevated reading as shown on the graph. No other stations had readings above the initial threshold concentration.
Note that the Action Level = Initial Threshold Concentration + Upwind Concentration
3. Mercury Vapor Monitoring
Click Image to Enlarge
4. Turbidity Monitoring
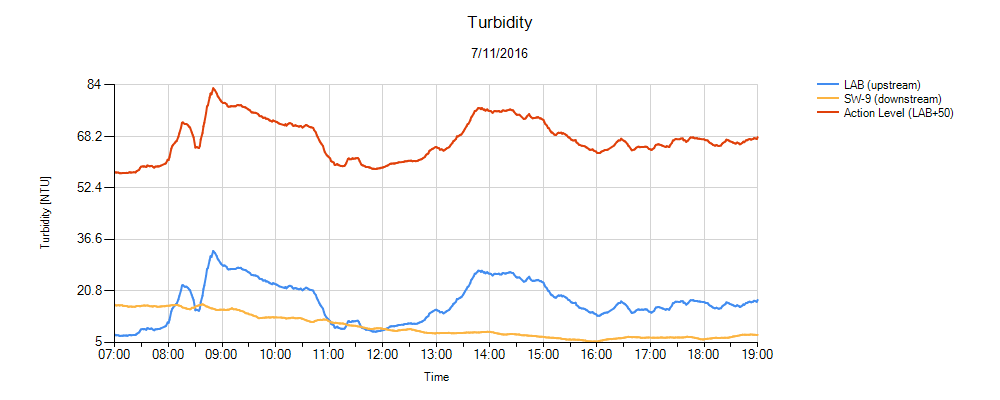
Click Image to Enlarge
View Archives