
Monitoring Program Data View Archives
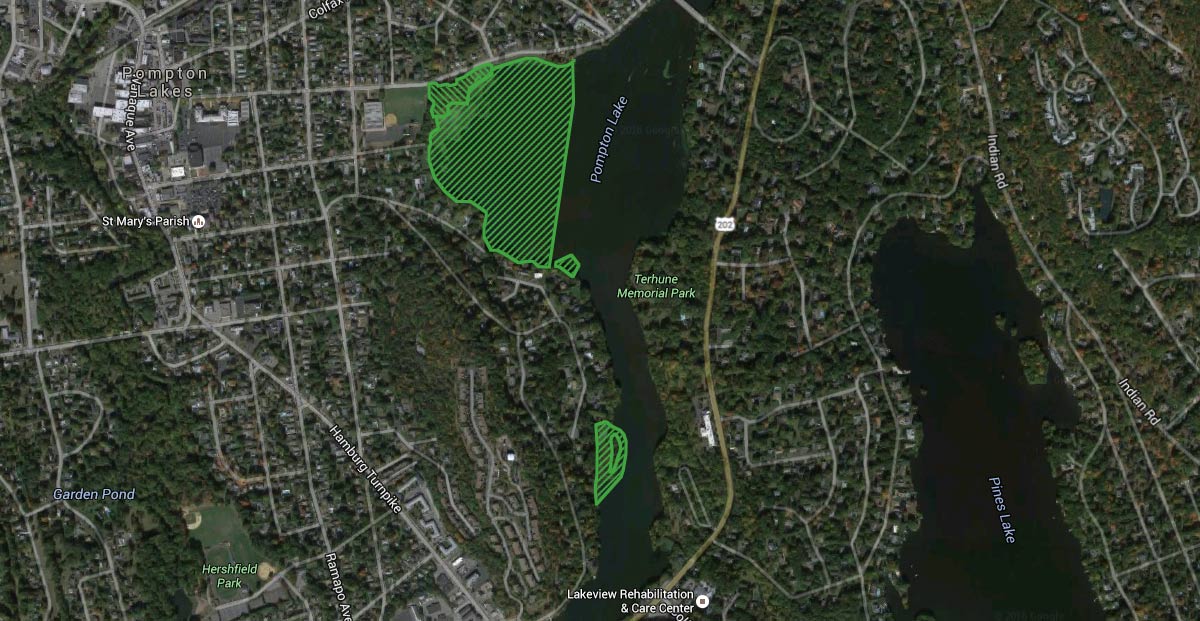
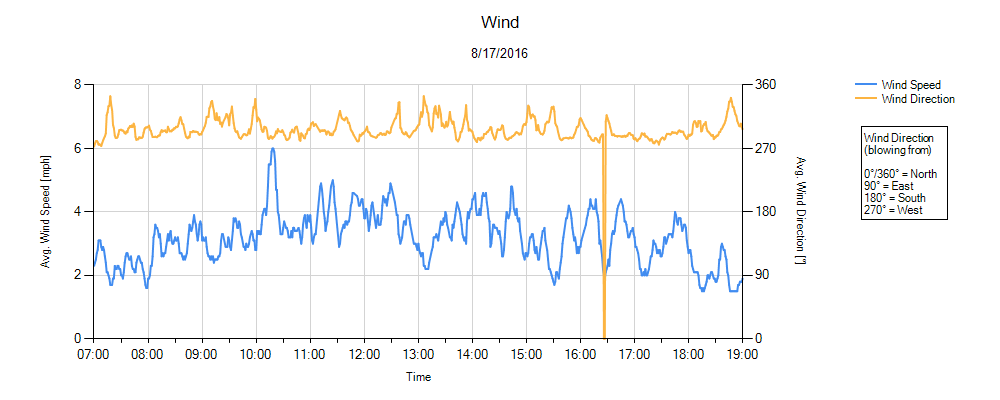
Environmental monitoring of surface water (turbidity), air (dust and mercury vapor), and noise was conducted in accordance with the CMI work plan during the removal phases of the remediation program. Chemours is committed to sharing monitoring data (turbidity, dust, mercury vapor) collected during remedy implementation with the community. The graphs below contain data from the various monitoring locations around the project area.1. Wind Monitoring
Click Image to Enlarge
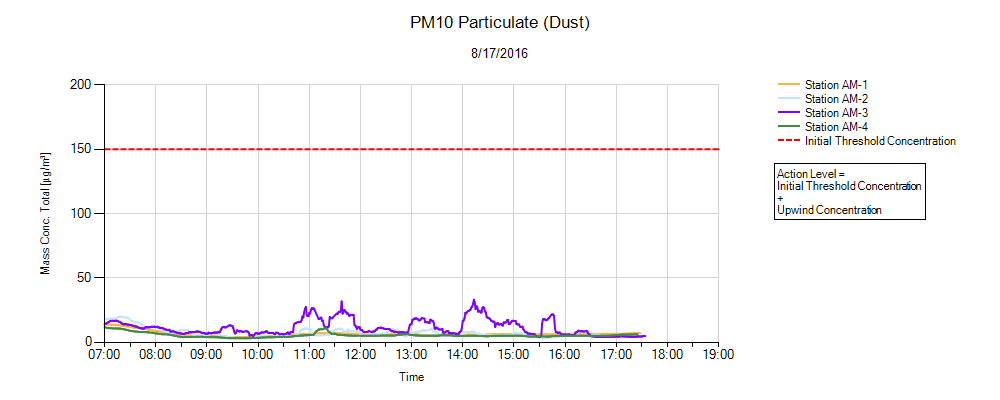
2. PM10 Particulate (Dust) Monitoring
Click Image to Enlarge
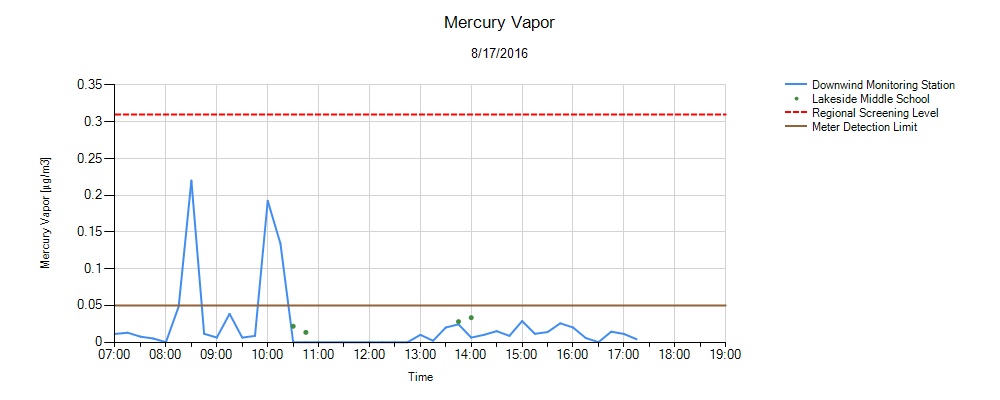
3. Mercury Vapor Monitoring
Click Image to Enlarge
Comments
Due to the continued heat and humidity, the mercury vapor meter at the downwind monitoring station was intermittently malfunctioning during the morning.
Work activities predominantly consisted of the receiving and spreading of clean backfill for the day. No excavation took place and only a limited number of trucks were loaded out with material during the early morning.
The two elevated mercury vapor concentrations shown on the graph indicate false positive readings based on the known work activities at the time.
Personnel monitoring of mercury vapor being conducted in the work zone showed no exceedances during the course of the day.
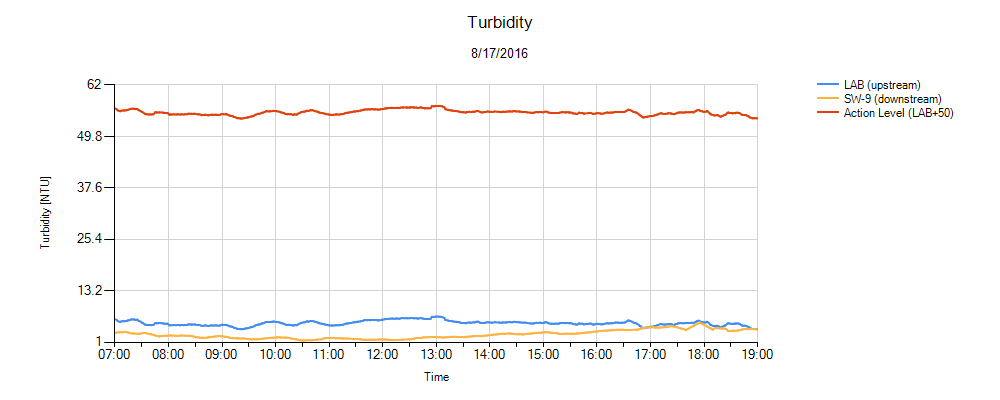
4. Turbidity Monitoring
Click Image to Enlarge
View Archives