
Monitoring Program Data View Archives
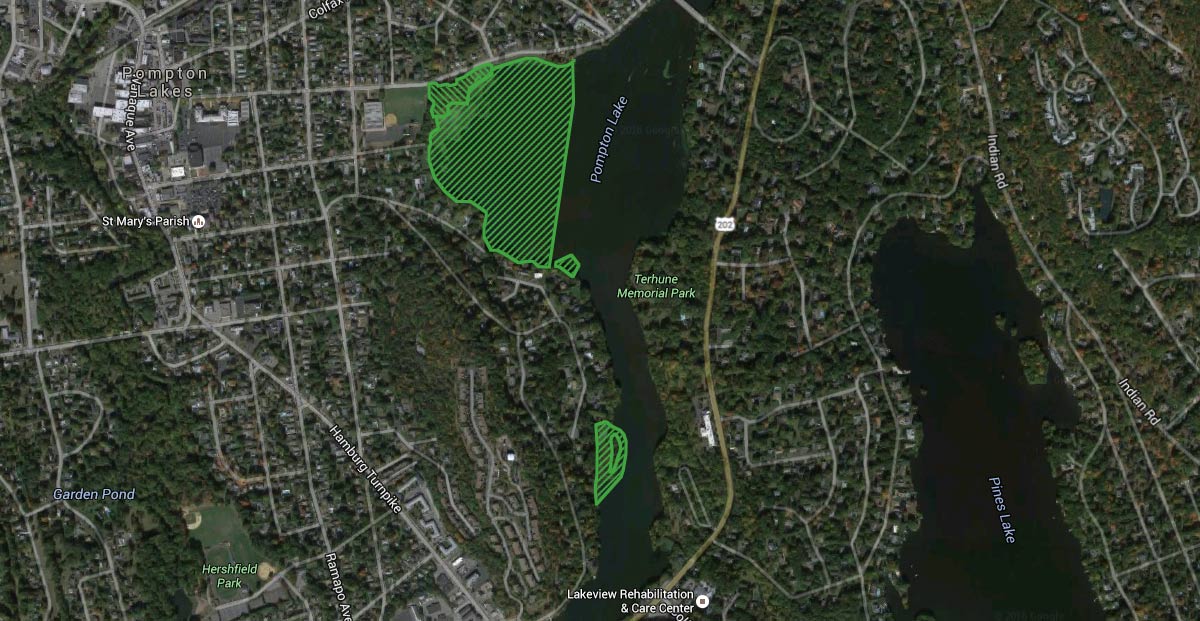
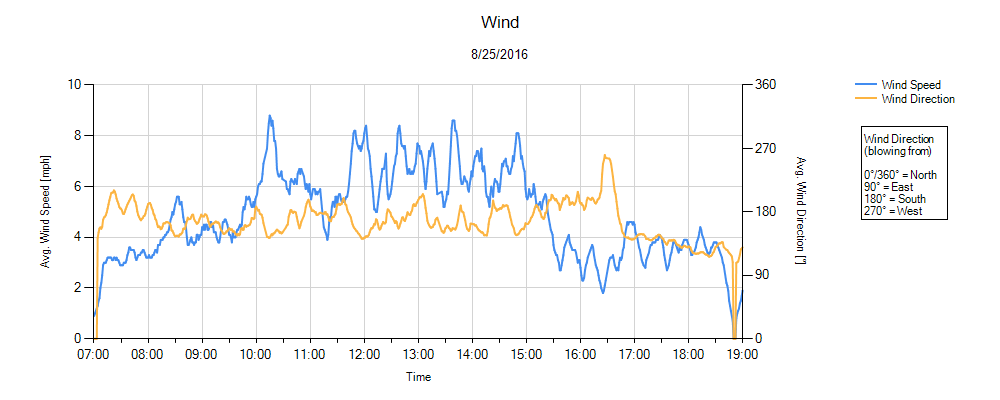
Environmental monitoring of surface water (turbidity), air (dust and mercury vapor), and noise was conducted in accordance with the CMI work plan during the removal phases of the remediation program. Chemours is committed to sharing monitoring data (turbidity, dust, mercury vapor) collected during remedy implementation with the community. The graphs below contain data from the various monitoring locations around the project area.1. Wind Monitoring
Click Image to Enlarge
2. PM10 Particulate (Dust) Monitoring

Click Image to Enlarge
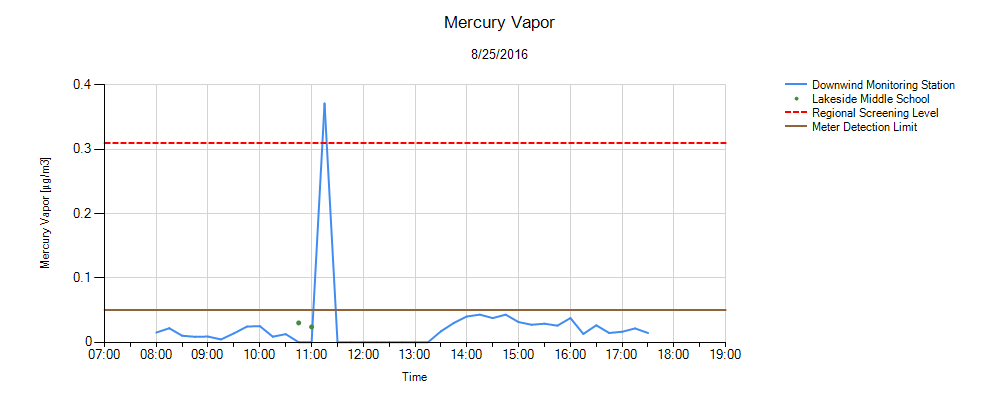
3. Mercury Vapor Monitoring
Click Image to Enlarge
Comments
Based on a review of the mercury vapor data and site activities on this day (there were no excavation or load-out activities), it appears there was a mercury meter malfunction (due to continued heat and humidity) at the downwind monitoring station causing the elevated reading as shown on the graph. None of the other 15-minute average mercury readings collected during this monitoring event were above the instrument’s detection limit of 0.05 µg/m3 and were below the threshold level of 0.31 µg/m3.
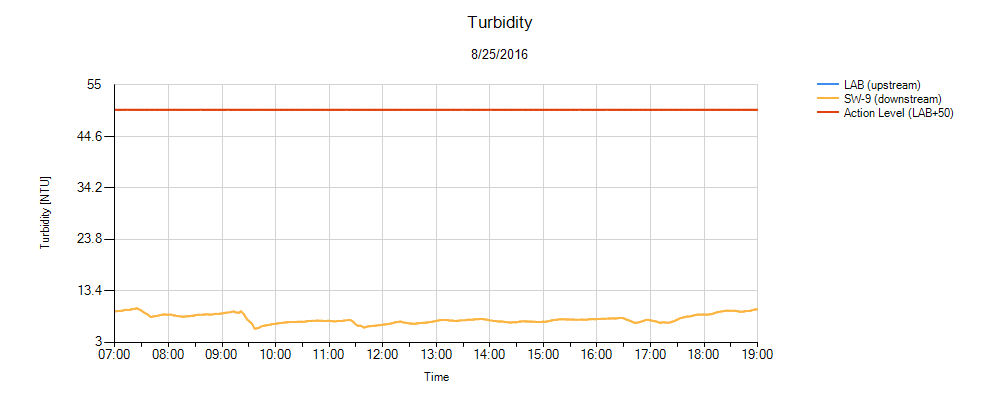
4. Turbidity Monitoring
Click Image to Enlarge
Comments
It has been determined that there is a battery malfunction at the upstream monitoring location. A new battery is being procured and will be installed during the early portion of the week of August 29, 2016.
View Archives