
Monitoring Program Data View Archives
Environmental monitoring of surface water (turbidity), air (dust and mercury vapor), and noise was conducted in accordance with the CMI work plan during the removal phases of the remediation program. Chemours is committed to sharing monitoring data (turbidity, dust, mercury vapor) collected during remedy implementation with the community. The graphs below contain data from the various monitoring locations around the project area.1. Wind Monitoring
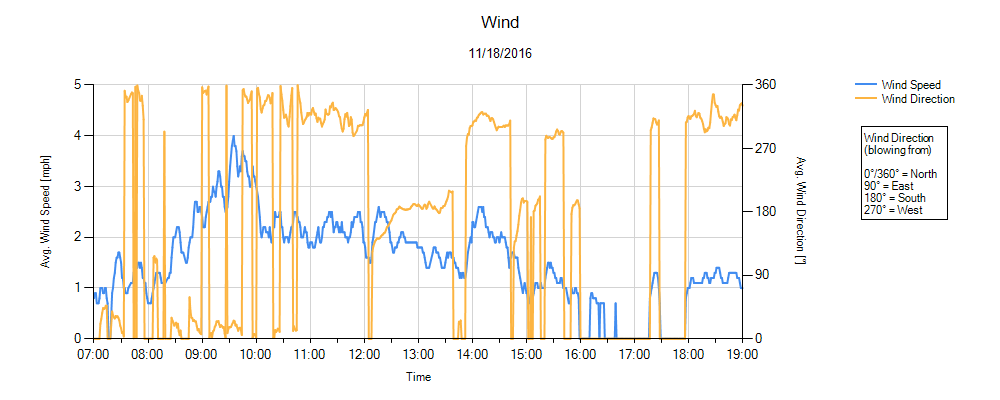
Click Image to Enlarge
2. PM10 Particulate (Dust) Monitoring
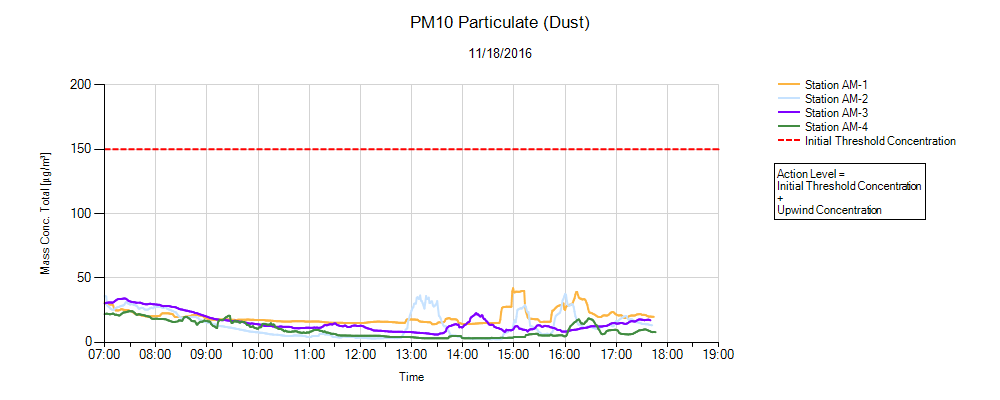
Click Image to Enlarge
3. Mercury Vapor Monitoring
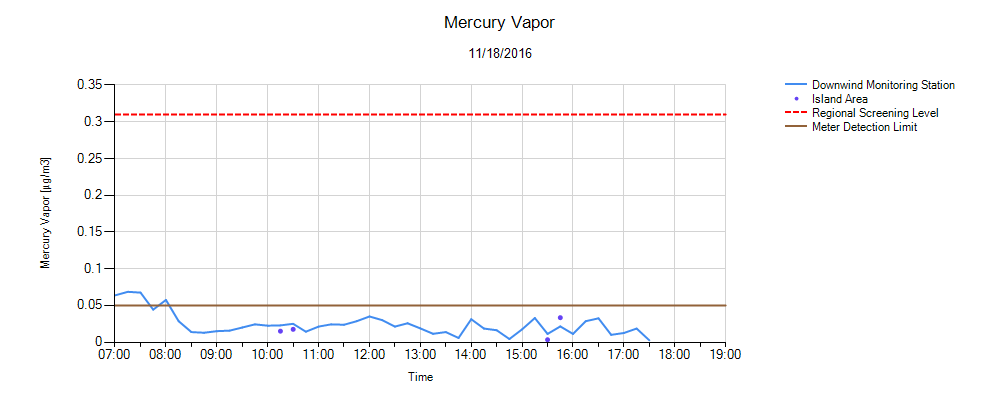
Click Image to Enlarge
4. Turbidity Monitoring
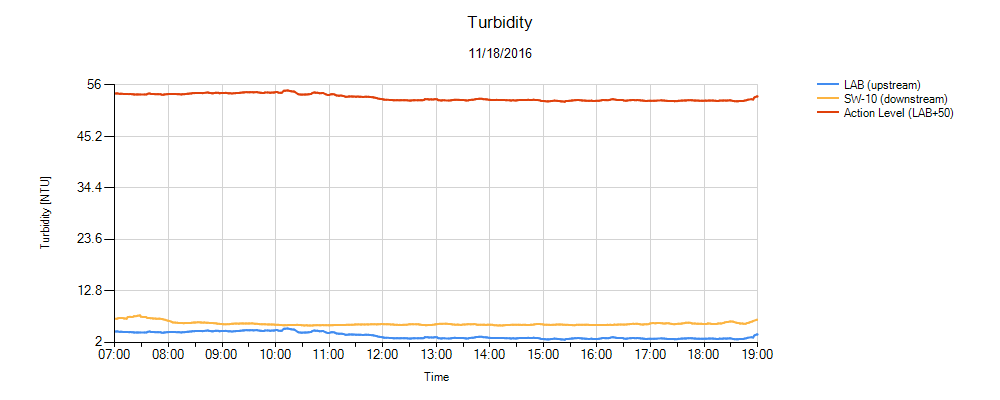
Click Image to Enlarge
View Archives