
Monitoring Program Data View Archives
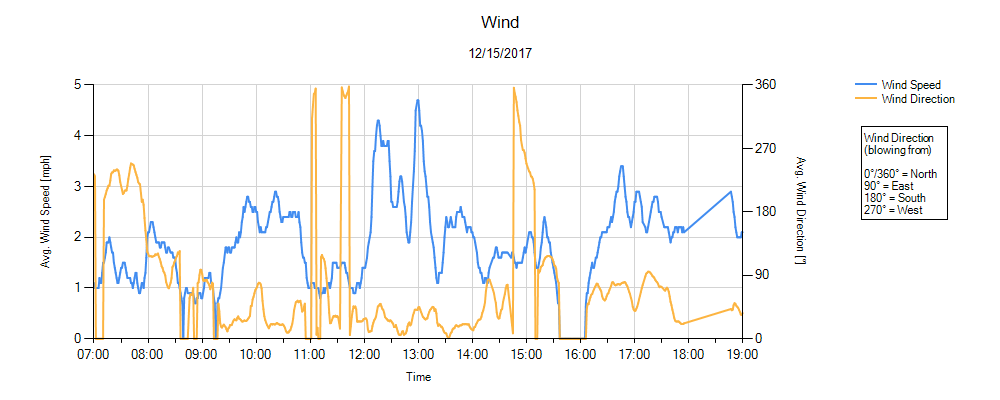
Environmental monitoring of surface water (turbidity), air (dust and mercury vapor), and noise was conducted in accordance with the CMI work plan during the removal phases of the remediation program. Chemours is committed to sharing monitoring data (turbidity, dust, mercury vapor) collected during remedy implementation with the community. The graphs below contain data from the various monitoring locations around the project area.1. Wind Monitoring
Click Image to Enlarge
Comments
NOTE: Due to the snow on Thursday, December 14, 2017 and the lack of any sediment operations, the wind meter was not set up to collect data. The only activity that took place on this day was demobilization of large-scale equipment.
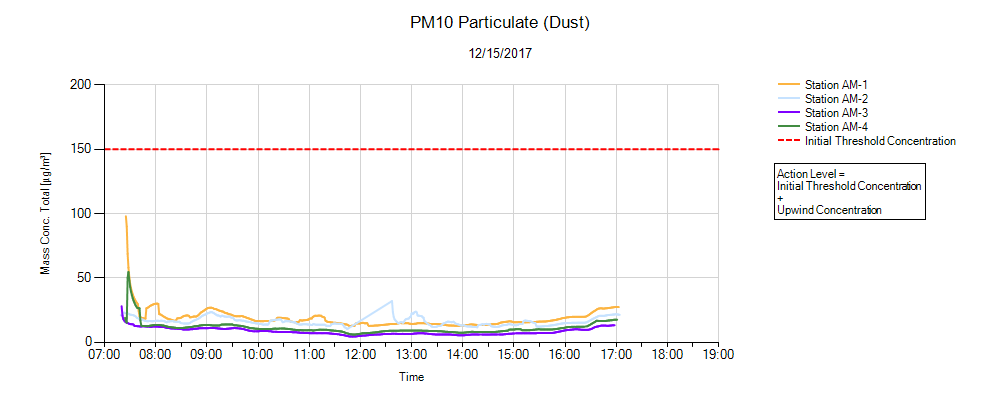
2. PM10 Particulate (Dust) Monitoring
Click Image to Enlarge
Comments
NOTE: Due to the snow on Thursday, December 14, 2017 and the lack of any sediment operations, the dust meters were not set up to collect data. The only activity that took place on this day was demobilization of large-scale equipment.
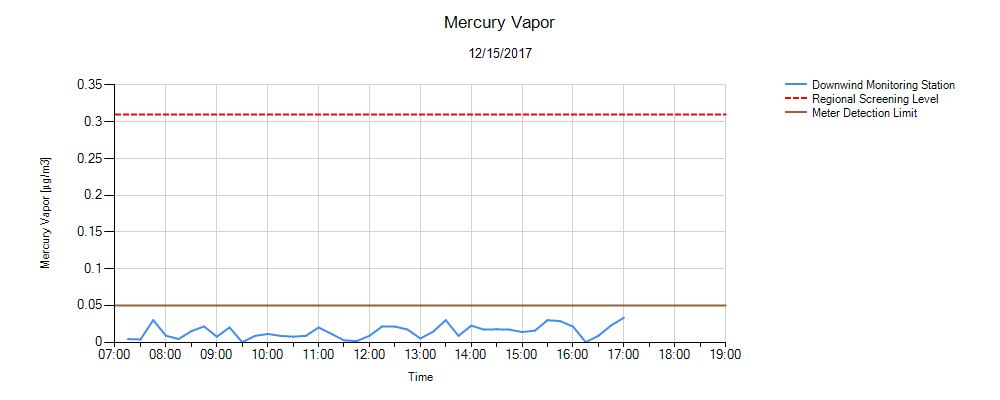
3. Mercury Vapor Monitoring
Click Image to Enlarge
Comments
NOTE: Due to the snow on Thursday, December 14, 2017 and the lack of any sediment operations, the mercury vapor meter was not set up to collect data. The only activity that took place on this day was demobilization of large-scale equipment.
4. Turbidity Monitoring

Click Image to Enlarge
Comments
NOTE: No water work took place on Thursday, December 14, 2017. As such, the turbidity meters were not set up to collect data. The only activity that took place on this day was demobilization of large-scale equipment.
View Archives